Brand Positioning 101: The Ultimate Guide (Part 3)
How to Differentiate Your Brand for Long Term Sales Growth, Customer Loyalty, and Market Domination
 2 MINUTE READ
By Cedric Bernard, CEO, Adkom
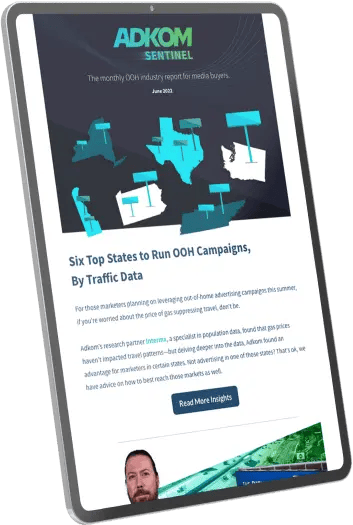
For those marketers planning on leveraging out-of-home advertising campaigns this summer, if you’re worried about the price of gas suppressing travel, don’t be.
Population data firm Motionworks, formally known as InterMX, has been tracking traffic volumes to determine the effect of rising gas prices. Their insights reflect that, despite an increase in gas prices of 51%, average daily traffic volume remains roughly the same in Q1 2022 as it was pre-pandemic in Q1 2020.
The spike in gas prices does not offset the move towards increased travel as people return to normal. Kym Frank, Global Chief Experience Officer of Motionworks, says, “This data signifies that traffic has made a full recovery to pre-COVID levels: big news for the out-of-home industry.”
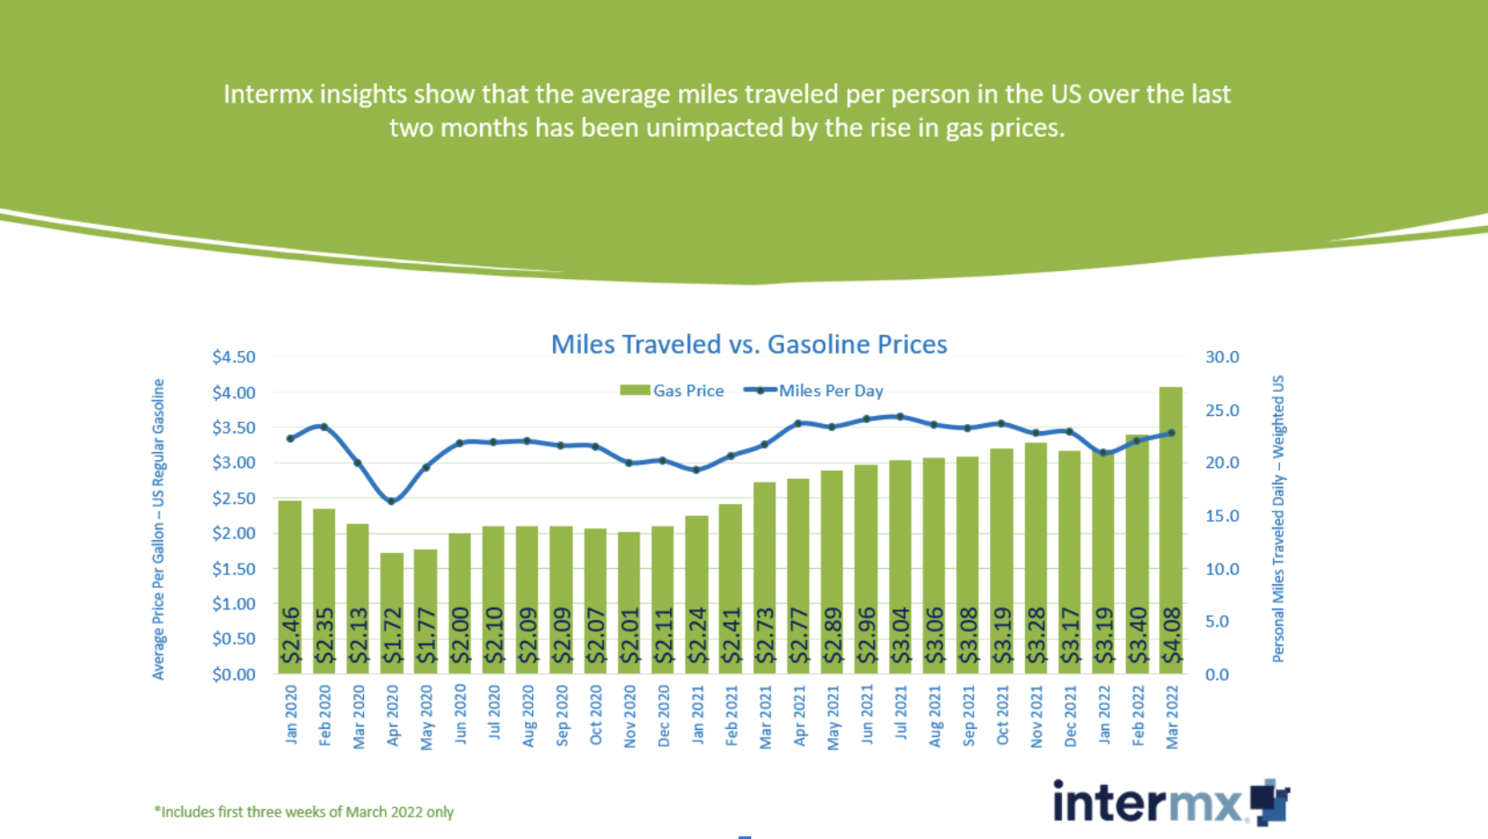
Fortunately, for the advertiser looking for an advantage, one can be teased from the data. While overall traffic levels are comparable to previous levels, some states have a slight increase while others modestly decrease.
In general, many of those that grew have more rural populations, possibly pointing to more travel time needed to access work, school, healthcare, and other needs.
In contrast, some of those that declined have some of the nation’s most significant urban centers (or at least more white-collar workers); the decrease may result from an increase in urban dwellers permanently working from home.
Accordingly, here are the six states where the average personal daily miles traveled increased by 3% or more:
In contrast, here are the states that saw a decrease in daily miles traveled by 3% or more from 2020-2022:
If you are running a national billboard campaign, especially one tapping into major commuter arteries, the above six states give you a slight edge for reaching drivers.
If you need to target other states, however, there’s a simple workaround: rather than focus on billboards, get out on the street.
Other recent research confirmed that residents in big cities spend less time traveling into downtowns and more time staying in their local neighborhoods. They’re spending more time outside, on foot, and shopping in brick-and-mortar stores. Reaching them requires getting into those neighborhoods—something that street furniture (like bike share kiosks and mobile carts), wall hangings, and other forms of street-level signage can do in spades.
Another area of growth is physical locations like gas stations, coffee shops, malls, and sit-down restaurants, all of which are seeing an increase in visitors in Q1 2022. You can get in front of consumers with place-based media that often offer full-motion video to hyper-focused audiences.
This mix of street-level and place-based media in urban centers and billboards along main non-urban commuter routes like highways offer an excellent mix to take advantage of traffic trends and gain the greatest reach possible.Source: Privately-released data from Motionworks International
Making the call about what media to run where drives fundamental differences in campaign results. Sign up for the industry’s premier OOH + brand-building newsletter.